Lindholm: Can Super Bowl Winners Be Predicted?
By Scott Lindholm-
(CBS) The Broncos are favored to win Sunday's Super Bowl by two to three points.
Since 1978, Vegas odds have predicted the winner 23 of 35 times, so it certainly can be done, but even experts struggle.
No one predicted the Giants beating the Patriots after the 2011 or 2007 seasons. However, there are eight telling measures in which Super Bowls winners have often had an advantage over their opponent -- and all are on the same side of the ball.
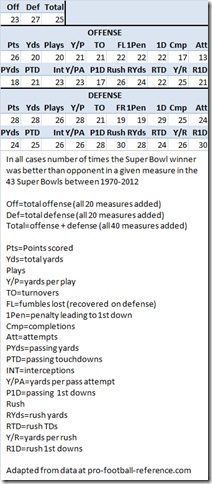
All data begins with the 1970 Super Bowl, the year the NFL and AFL merged. I obtained data from pro-football-reference.com for team ranks in 20 categories on both offense and defense, looking at league rank of the two Super Bowl teams in a given category to see if the higher-ranked team had an advantage over the lower-ranked team. There have been 43 Super Bowls played since 1970, with the year referring to the regular-season year (for example, the 1970 Super Bowl was played on Jan. 17, 1971).
On offense, the best predictor of Super Bowl victory was points scored -- 26 of those 43 Super Bowl victors scored more regular-season points than their opponents. Rush attempts (26 winners had more rush attempts than their opponents) and yards per rush (25 had a better average) ranked high as well. This makes sense: Higher-scoring teams obviously have an advantage, and teams that run more are indicative of winning, as teams often run the ball because they're ahead. Every other aspect of better offense (shown in a chart at the end of this post) ranged from 13 to 24 Super Bowl victors.
What about adding the offensive numbers together to see how well a team's overall offense performed? The Super Bowl victor entered with the better offense 23 out of 43 times, just more than half the time. It appears offense has little predictive value in determining Super Bowl outcomes -- the numbers are so close to 50 percent that they imply random chance.
Defense is a totally different matter. Thirty of the 43 winners were better than their opponents in two measures: rushing first downs allowed and rush attempts allowed. This is the inverse to offensive rushing, as opponents run less when behind and pass to catch up.
After than, 29 winners entered the Super Bowl allowing fewer first downs, while 28 winners entered allowing fewer points, fewer opponent rushing yards, fewer yards, fewer yards per play and fewer passing first downs.
Put simply, those are eight measures on defense that correlated with the Super Bowl winner 65 percent of the time or more, compared to none on offense on the flip side.
So in the majority of Super Bowls, teams playing better defense during the regular season won, with 27 of the 43 winners having a better defense. On the flip side, 23 teams with the better offense won (sometimes those overlap). Acknowledging that offense is far more important in the modern NFL, since 2000 teams with better defenses still defeated teams with better offenses in seven of 13 games.
What does it mean for this Sunday? It should be a very good game, only the fifth in Super Bowl history in which the No. 1 team in points scored faces the No. 1 team in points allowed. Dan Bernstein described it as an "immovable force meets unstoppable object" type of game earlier this week, but history suggests it might not be the case.
The Broncos scored almost 200 points more (606 to 417) than the Seahawks, but Seattle allowed almost as many fewer points (231 to 399). History isn't always correct, but it suggests Seattle will win. Nothing should be written in stone when Peyton Manning is on the other side of the ball, but historically stellar defense trumps stellar offense on the Super Bowl stage. I have every expectation it will be an outstanding game to watch which can go either way, but I'm down for Seattle.
Other facts going back to 1978 (the first year odds are available on pro-football-reference.com):
-- Teams that scored first won 20 of 35 times.
-- Teams with the better record won 18 of 28 (teams had the same record in five games).
-- Favored team won 23 of 35 (see a list for all Super Bowls here).
Scott Lindholm is a web columnist for The Score. Follow him on Twitter at @ScottLindholm.