On The Grid: City Maps Colorized By Street Orientation
By John Dodge
CHICAGO (CBS) -- As a traveller approaches the city from the air at night, the outlines of the city's street lights stand in stark contrast to the pell-mell curvature of its suburban neighbors
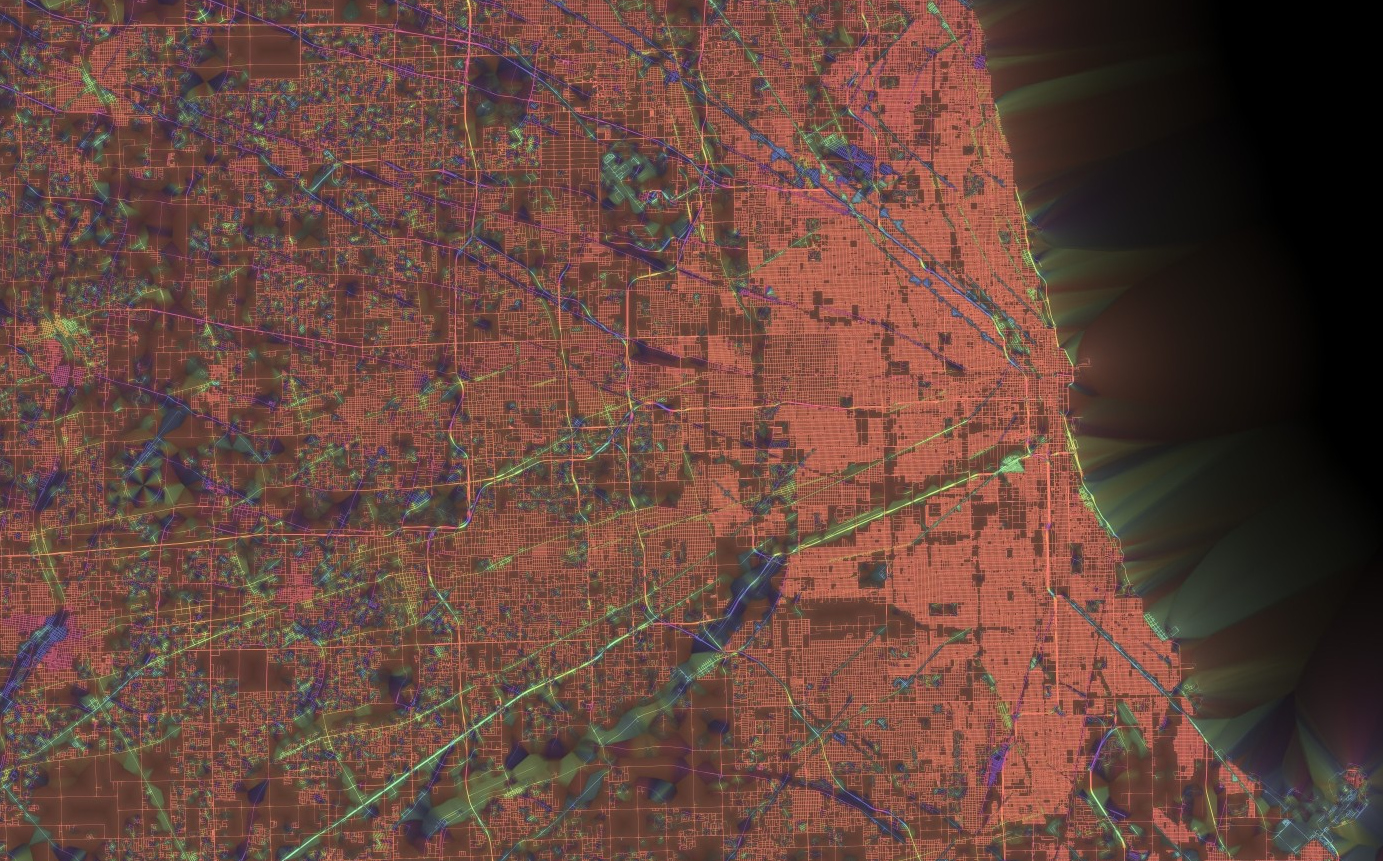
The layout of Chicago's street grid is so precise that it looks like a mathematician's graph paper.
It is probably the griddiest of the urban centers in the world, as evidenced by these colorized maps by artist and scientist Stephen Von Worley.
Von Worley, who operates a blog called Data Pointed, used a variety of mapping techniques to colorize cities based on street orientation. Each portion of the city that had streets oriented in one direction, with cross streets at 90 degree angles were assigned a specific color.
Basically, any area that looks most like a piece of graph paper got a single color. It may come as no surprise that Chicago is outlined almost entirely in a single color: orange.
(Click on the images to enlarge.)
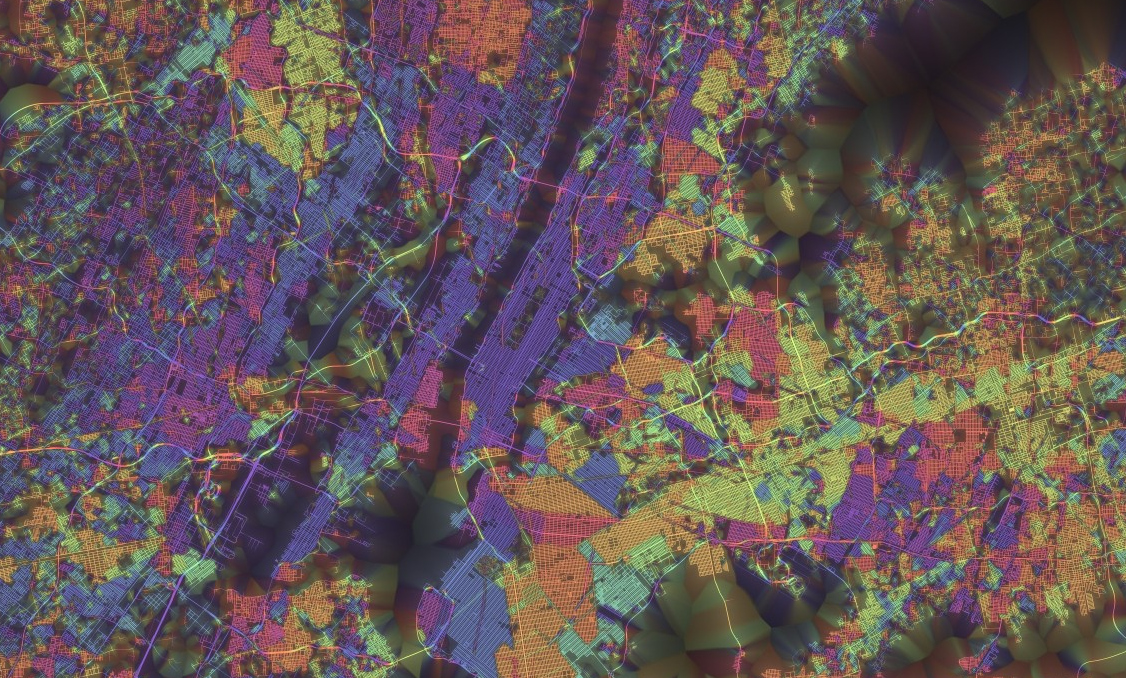
In New York City, Manhattan stands out in violet, as the surrounding boroughs and towns turn into a kaleidoscope.
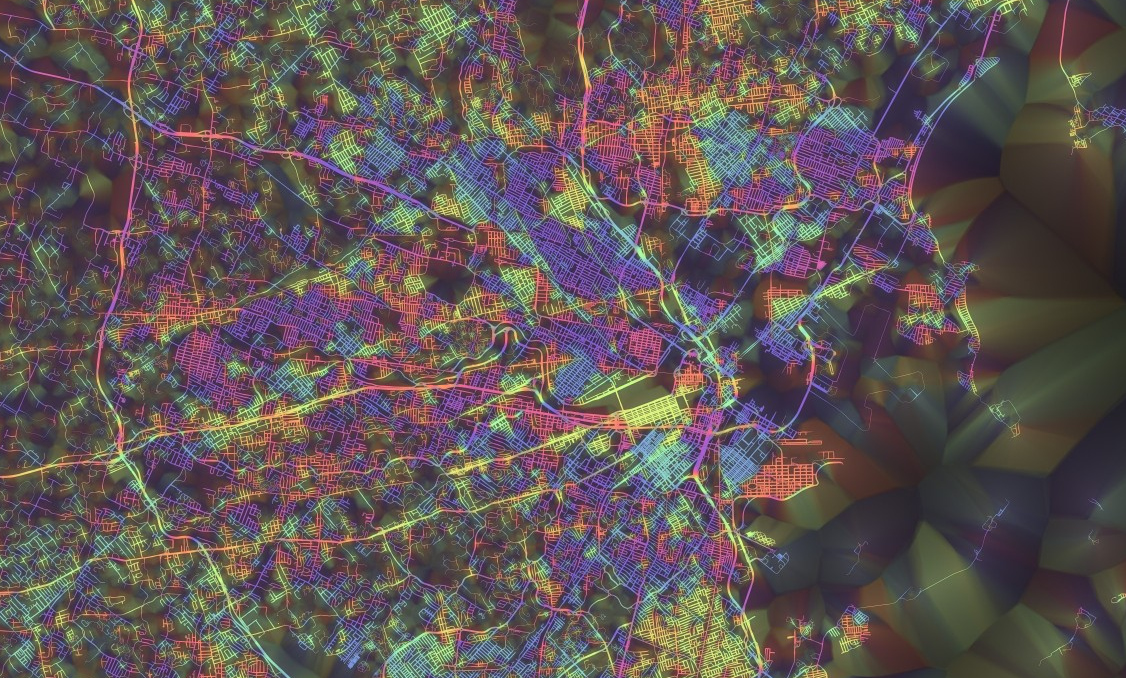
Boston, with pockets of right-angled neighborhoods, appears more like a piece of Louis Comfort Tiffany's stained glass.
The views of London?
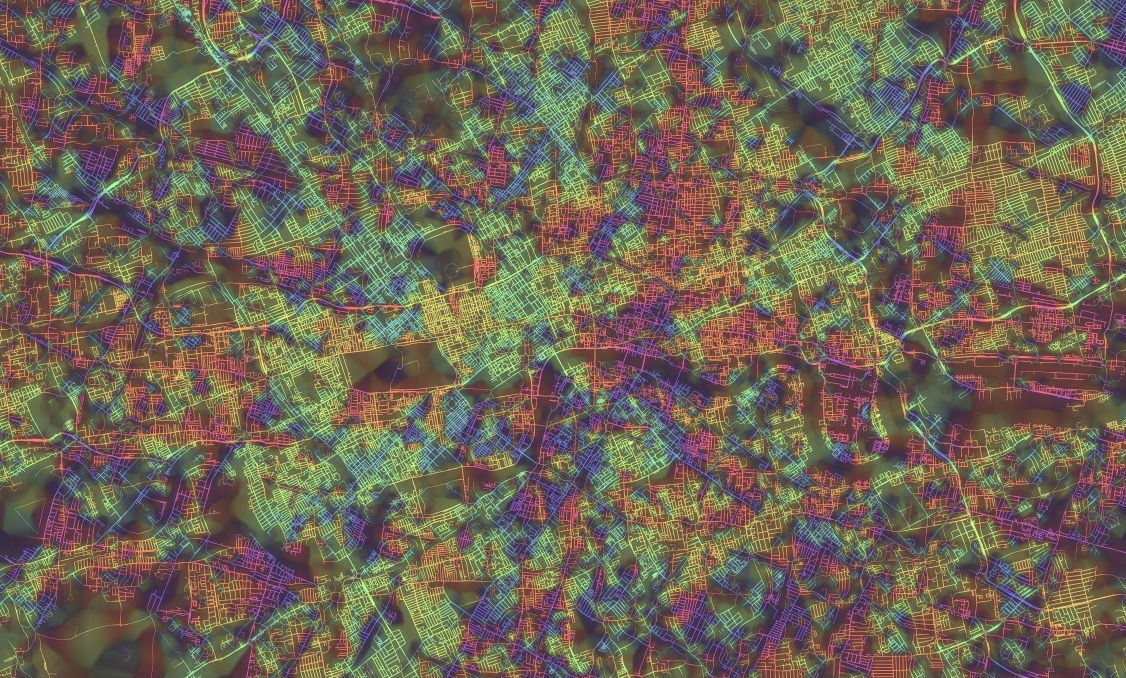
And Paris?
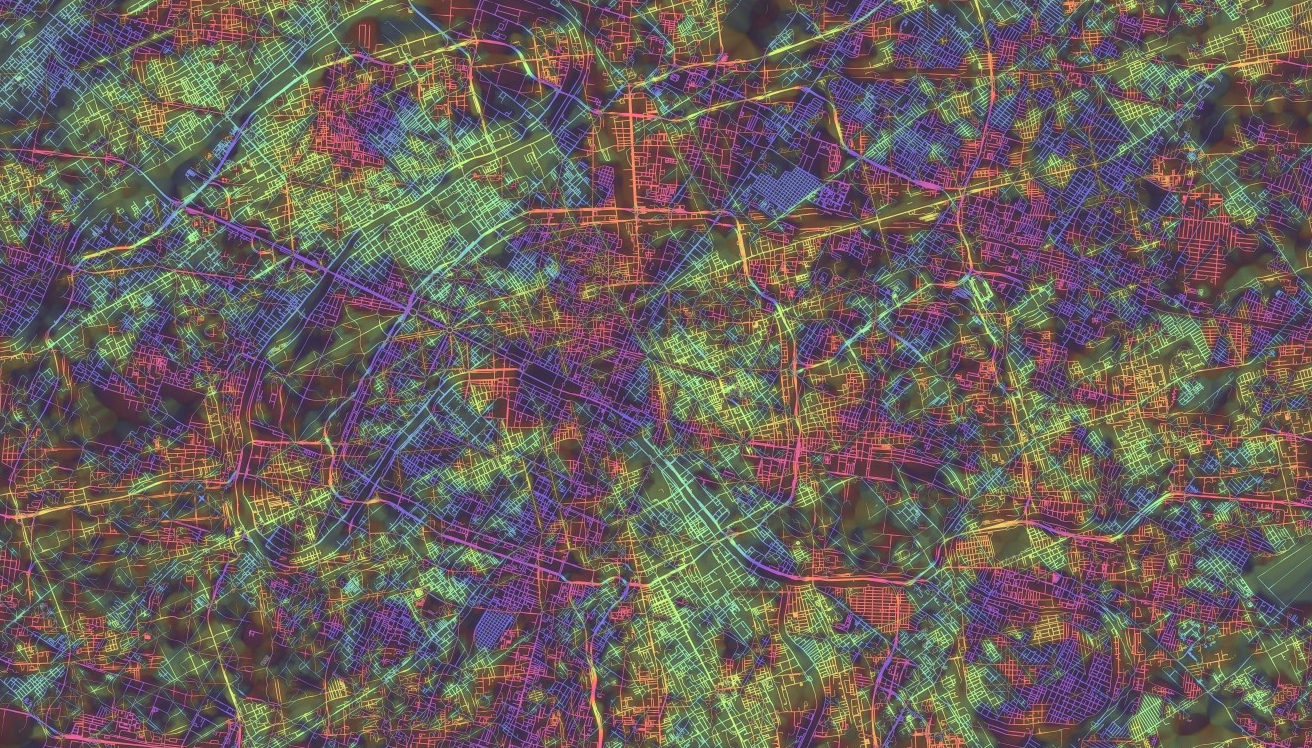
They look like they were drawn by one of Timothy Leary's patients.
"Lots of stories in there: of cities waxed, towns waned, territory absorbed, and terrain negotiated," Von Worley wrote on his blog.
These static images don't provide the full, interactive effect of Von Worley's work, which can be found here.