Animated Map Tracks Potholes Across Chicago
By John Dodge
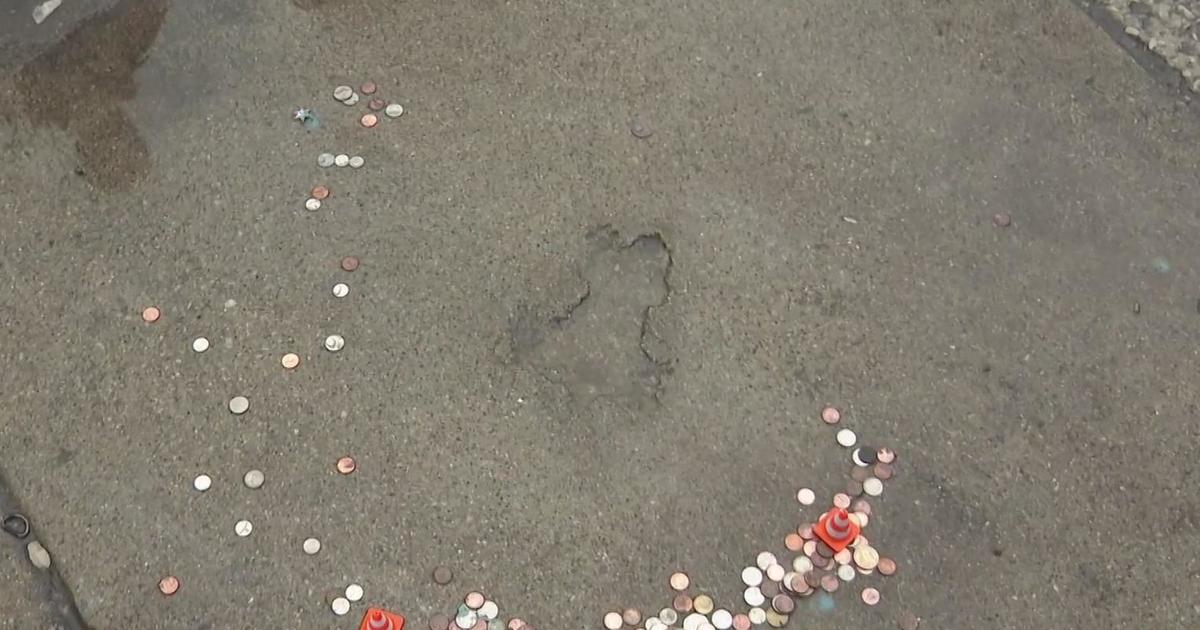
CHICAGO (CBS) -- The melting snow and ice gradually revealed the damage done underneath, a pock-marked moonscape of destruction on the city's streets.
Potholes.
Everywhere.
There have been nearly 260,000 pothole repair requests made to the Chicago's 311 hotline this winter season.
That's way too many to spot on a stationary, single map.
Elliott Ramos, a former Chicagoan now working for the Wall Street Journal in New York, solved that.
He created a time-lapsed map that charts the city pothole requests from November-March. (He was one of the lucky ones, as he started his job there in September.)
The animation is fascinating to watch, as viewers can quickly begin to spot trends.
The map is fairly dark for the first month, with a relatively few number of light orange dots popping on the screen.
The action heats up in mid-January, which makes sense because Chicago had several days of snow to start the new year, which began to melt before a brutal deep freeze set in. That's the perfect breeding ground for pothole formation.
The same thing happens around the 20th of February and again around the same time in March, just has the final layers of snow to hit Chicago began to melt off.
Viewers can also zoom into specific neighborhoods to track trends in their area of interest.
Ramos downloaded the data from the City of Chicago's data portal.